AUSTIN-ROUND ROCK MSA HOUSING MARKET CONTINUES TO BALANCE, OUTPERFORM NATIONAL TRENDS
CENTRAL TEXAS HOUSING REPORT
Housing Market Trends: April 2023
As we navigate through 2023, the housing market presents a complex picture. Distinct trends are materializing across different property types and regions, painting a unique portrait of the current housing landscape.
Key Takeaways:
- The Metro area’s Months of Inventory shows a steady pattern, edging up slightly from 4.04 in February to 4.07 in March.
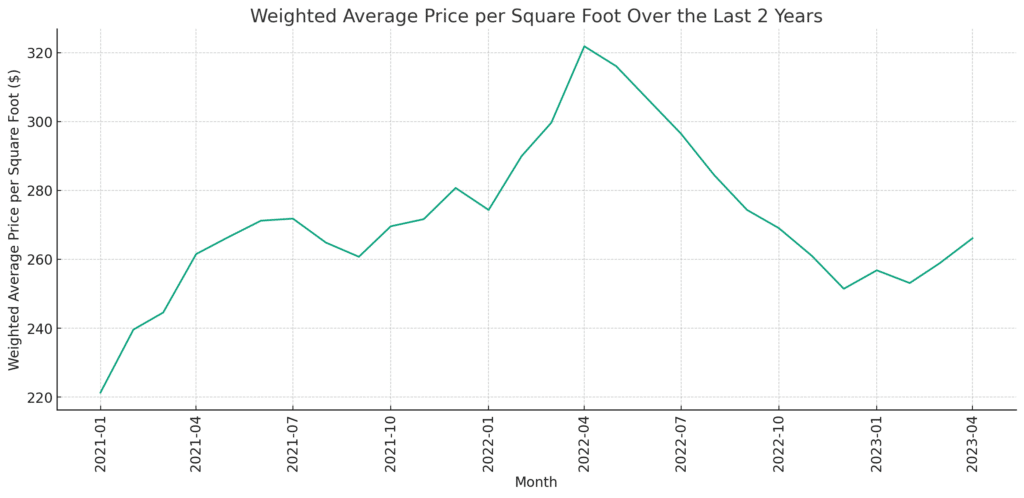
- The Average Sold Price in the Metro region saw a YoY dip of 12.2%, while the Median Sold Price registered a 13.6% decline.
- On the brighter side, the MoM figures show a promising 5.5% uptick in the Average Sold Price for the Metro area.
- Mortgage rates have remained consistent around the 6.5% threshold for the past four months, standing at 6.34% as of April 7th.
Market Pricing: A Closer Look While the YoY price decrease is notable, it’s not unexpected as we’re comparing current prices to those at the height of the pandemic market in April/May 2022. The silver lining, however, is the 5.5% MoM price increase from February to April 2023. This upward trend in MoM pricing, a bellwether in a shifting market, signals that the market is reaching a state of equilibrium. Although seasonal demand and price fluctuations are likely, we believe the market price correction has bottomed out.

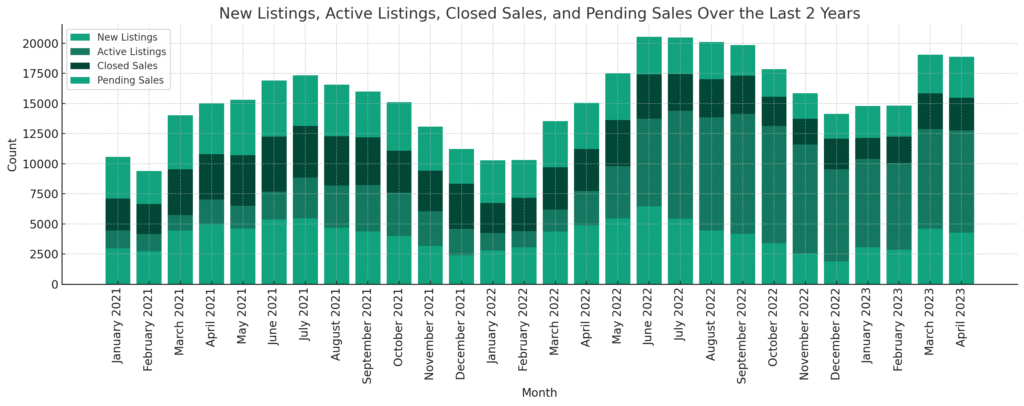
Contracts on the Upswing: The number of pending units, a reliable gauge of market demand, saw a relatively small YoY decrease of 6.6%, marking the most robust performance in the past 12 months. Although supply has significantly expanded compared to the pandemic years (approximately 4 Months of Inventory compared to less than 1 Month of Inventory during the pandemic), demand remains strong in the market.

Stabilization: Setting the Stage for Recovery The noteworthy development is the four-month stabilization of the Average Sold Price, Months of Inventory, and Mortgage Rates. This stability typically preempts a market recovery. Our projections suggest that the market will maintain its stability for most of 2023, begin recovery towards the end of the year, and possibly see a moderate to strong rebound in Q1 2024.
Buyers’ Corner: Given the robust inventory in the market, it’s an opportune time for buyers, especially since they now have the upper hand in negotiations. It’s crucial to understand your specific position in your target sub-market. There are excellent opportunities to purchase new construction at a discount, but these will quickly vanish once builders deplete their inventory this year. The entry-level and median price points are currently the most buoyant sub-markets, while the luxury segment remains sluggish. We’re on hand to provide tailored advice and data insights for your specific sub-market.
Sellers’ Perspective: If you’re selling within the entry-level to median price point and you’re not competing with builders, the market conditions are in your favor. However, if your property is in a neighborhood with active new builds on the market, you’ll need to price your property below those new builds to sell this year. Pricing is particularly critical in the luxury markets. We’re here to help you navigate these gray areas and understand your unique position.
Remember, real estate is extremely localized and situational. We’re more than happy to discuss your individual circumstances and help strategize in your best interest!

City of Austin – April 2023
In April, home sales decreased 31.0% to 740 sales, while sales dollar volume decreased 34.8% to $543,967,464. At the same time, median price decreased 11.4% to $565,000 for the City of Austin. Last month, new listings slightly decreased 0.6% to 1,359 listings, active listings skyrocketed 216.0% to 2,357 listings as pending sales declined by 9.9% to 949 pending sales. Monthly housing inventory increased 2.5 months year over year to 3.2 months of inventory.

Travis County – April 2023
In Travis County, home sales decreased 28.6% to 1,167 sales, while sales dollar volume dropped 34.9% to $839,004,026. Last month, the median price in Travis County dipped 13.3% year over year to $537,500, new listings decreased 7.7% to 2,047 listings and active listings ballooned 211.5% to 3,975 listings year over year. Pending sales declined 8.5% to 1,502 pending sales as monthly housing inventory increased 2.5 months year over year to 3.3 months of inventory.

Williamson County – April 2023
April home sales decreased 11.2% to 919 sales and sales dollar volume declined 22.2% year over year to $457,918,942 in Williamson County. The median price decreased 12.8% to $445,000 as new listings also decreased 19.8% to 1,247 listings. During the same period, active listings soared 178.0% to 2,346 listings while pending sales slightly rose 4.7% to 1,092 pending sales. Housing inventory rose 1.9 months to 2.6 months of inventory.

Hays County – April 2023
In Hays County, April home sales rose slightly 1.1% to 361 sales while sales dollar volume dropped 19.0% to $182,586,736. The median price for homes fell 16.9% to $416,500. During the same period, new listings decreased 12.2% to 520 listings, while active listings skyrocketed by 243.5% to 1,319 listings. Pending sales increased 8.5% to 445 pending sales as housing inventory jumped by 2.6 months to 3.6 months of inventory.

Bastrop County – April 2023
Last month, Bastrop County home sales decreased 14.1% year over year to 122 sales, while sales dollar volume also decreased 24.1% to $49,966,019. Median price dipped 5.3% to $380,000 as new listings ticked up 22.9% to 215 listings. Active listings soared 220.9% to 507 listings as pending sales also increased 35.8% to 167 pending sales. Housing inventory increased by 2.9 months to 4.1 months of inventory, the highest level of inventory across the MSA in April.

Caldwell County – April 2023
In Caldwell County, home sales decreased 14.3% to 42 closed sales, and sales dollar volume dropped 17.3%
to $14,423,495. The median home price fell 15.1% year over year to $297,000. At the same time, new listings increased by 38.7% to 86 listings as active listings skyrocketed 245.0% to 138 listings. Pending sales increased 35.6% to 61 pending sales, and housing inventory increased 2.1 months to 3.3 months of inventory.
