Austin Local Team Report
Central Texas Housing Market Update – July 2023
The Austin housing market, renowned for its dynamism, shows mixed indicators in July 2023. This report will explore the Month-over-Month, Year-over-Year, and a special focus on the June-July period of both 2022 and 2023. While closed sales have decreased MoM, certain ZIP codes are emerging as lucrative opportunities for investors and homeowners alike.Month-Over-Month Analysis (MoM) for July 2023:
- Closed Sales: Experienced a dip of 9.78% from June to July 2023.
- Dollar Volume: Saw a reduction of 11.72%.
- Average Price: Increased by 2.71%. This suggests that while fewer homes were sold, they were of higher value.
- Median Price: A rise of 1.81% was observed.
- Price/Sqft: Increased by 2.28% indicating a rise in property value.
- Days on Market: A significant reduction of 18.39% signals that homes were selling faster in July.
Implication for Sellers: Faster selling times means a seller’s market, where property owners might have an upper hand in negotiations.Year-Over-Year Analysis (YoY) for July 2023:
- Closed Sales: Increased by 4%.
- Dollar Volume: Rose by 3.25%.
- Average Price: A marginal increase of 0.15%.
- Median Price: Increased by 0.156%.
- Price/Sqft: Witnessed a 0.24% rise.
The comparison between 2022 and 2023 for the June-July period showcases:
- A decline in closed sales (16.88%).
- A decrease in the total value of closed sales (22.64%).
- A reduction in average price (14.18%) and median price (17.35%).
- A decrease in the price per square foot (16.71%).
- Properties took considerably longer to sell with an increase of 137.12% in days on the market.
- ZIP Code 78626: Massive growth with a 62.9% YoY increase in closed sales and an 8.9% rise in average prices.
- ZIP Code 76549: Stellar performance with closed sales up by 41.9% YoY and an average price rise of 8.9%.
- ZIP Code 78628: A promising 30.8% YoY bump in closed sales and a 2.5% YoY increase in average price.
Implication for Sellers: Residents in these ZIP codes might consider leveraging the surge in demand to command premium prices.

City of Austin – July 2023
- 837 – Residential homes sold, 1.3% more than July 2022.
- $550,000 – Median price for residential homes, 12.0% less than July 2022.
- 1,224 – New home listings on the market, 22.6% less than July 2022.
- 2,881 – Active home listings on the market, 20.0% more than July 2022.
- 847 – Pending sales, 13.2% more than July 2022.
- 3.9 – Months of inventory, 1.5 months more than July 2022.
- $588,966,529 – Total dollar volume of homes sold, 5.4% less than July 2022.

Travis County – July 2023
- 1,344 – Residential homes sold, 5.5% more than July 2022.
- $545,000 – Median price for residential homes, 9.2% less than July 2022.
- 1,836 – New home listings on the market, 26.7% less than July 2022.
- 4,697 – Active home listings on the market, 15.8% more than July 2022.
- 1,314 – Pending sales, 13.7% more than July 2022.
- 4.0 – Months of inventory, 1.4 months more than July 2022.
- $948,942,496 – Total dollar volume of homes sold, 3.0% less than July 2022.

Williamson County – July 2023
- 895 – Residential homes sold, 5.4% less than July 2022.
- $428,350 – Median price for residential homes, 11.7% less than July 2022.
- 1,247 – New home listings on the market, 28.1% less than July 2022.
- 2,788 – Active home listings on the market, 2.1% less than July 2022.
- 937 – Pending sales, 5.6% more than July 2022.
- 3.1 – Months of inventory, 0.5 months more than July 2022.
- $445,147,628 – Total dollar volume of homes sold, 14.5% less than July 2022.

Hays County – July 2023
- 400 – Residential homes sold, 0.3% less than July 2022.
- $405,243 – Median price for residential homes, 10.5% less than July 2022.
- 522 – New home listings on the market, 10.8% less than July 2022.
- 1,493 – Active home listings on the market, 31.1% more than July 2022.
- 439 – Pending sales, 27.3% more than July 2022.
- 4.1 – Months of inventory, 1.1 months more than July 2022.
- $207,159,668 – Total dollar volume of homes sold, 7.1% less than July 2022.

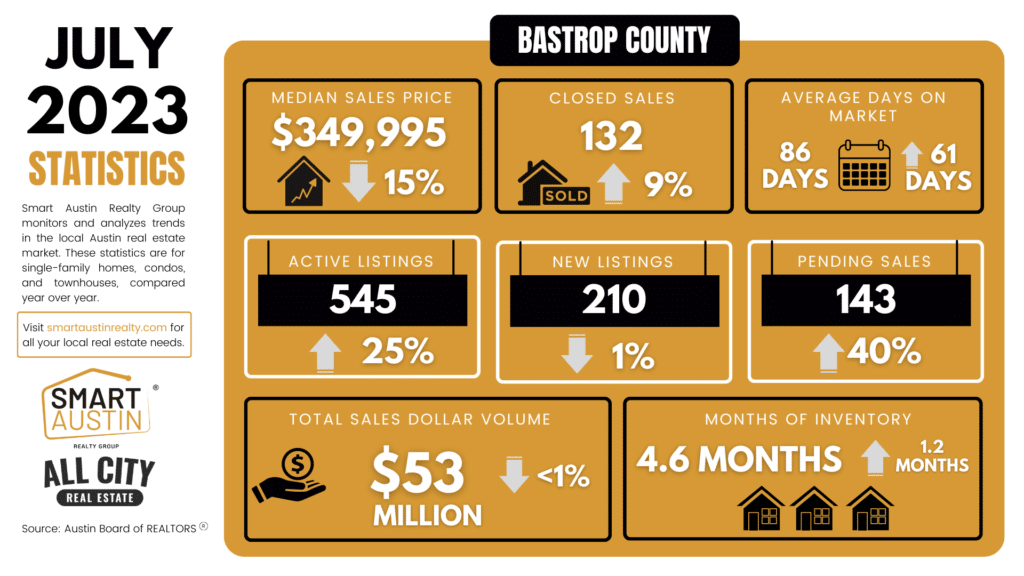
Bastrop County – July 2023
- 132 – Residential homes sold, 9.1% more than July 2022.
- $349,995 – Median price for residential homes, 15.7% less than July 2022.
- 210 – New home listings on the market, 1.9% less than July 2022.
- 545 – Active home listings on the market, 25.6% more than July 2022.
- 143 – Pending sales, 40.2% more than July 2022.
- 4.6 – Months of inventory, 1.2 months more than July 2022 and the highest inventory in the MSA.
- $53,217,578 – Total dollar volume of homes sold, 0.9% less than July 2022.

Caldwell County – July 2023
- 44 – Residential homes sold, 22.8% less than July 2022.
- $298,048 – Median price for residential homes, 20.2% less than July 2022.
- 69 – New home listings on the market, 38.0% more than July 2022.
- 140 – Active home listings on the market, 55.6% more than July 2022.
- 59 – Pending sales, 68.6% more than July 2022.
- 3.4 – Months of inventory, 1.1 months more than July 2022.
- $13,797,745 – Total dollar volume of homes sold, 41.0% less than July 2022.
Conclusion:
The Austin housing market in July 2023 presents a mixed bag. While the MoM data suggests a short-term decrease in volume, the YoY data and notable ZIP code performances indicate strategic growth opportunities. Both homebuyers and sellers can benefit from this unique market situation by making informed, strategic decisions.
For personal consultation and deeper insights into specific neighborhoods, reach out to our experts at Austin Local Team.
Data-driven decisions lead to dream homes. Let Austin Local Team guide you.
