Austin, Texas JUNE 2020 Housing Market Statistics
June home sales rebound across Austin area; sales decline in first half of 2020 due to COVID-19
AUSTIN, Texas—Home sales in the Austin-Round Rock Metropolitan Statistical Area (MSA) rebounded this June with a 9.3% increase year over year, which helped hold sales to only a 5.2% decline during the first half of 2020 as the market was impacted by COVID-19, according to the Austin Board of REALTORS® (ABoR) June and Midyear Central Texas Housing Market Report.
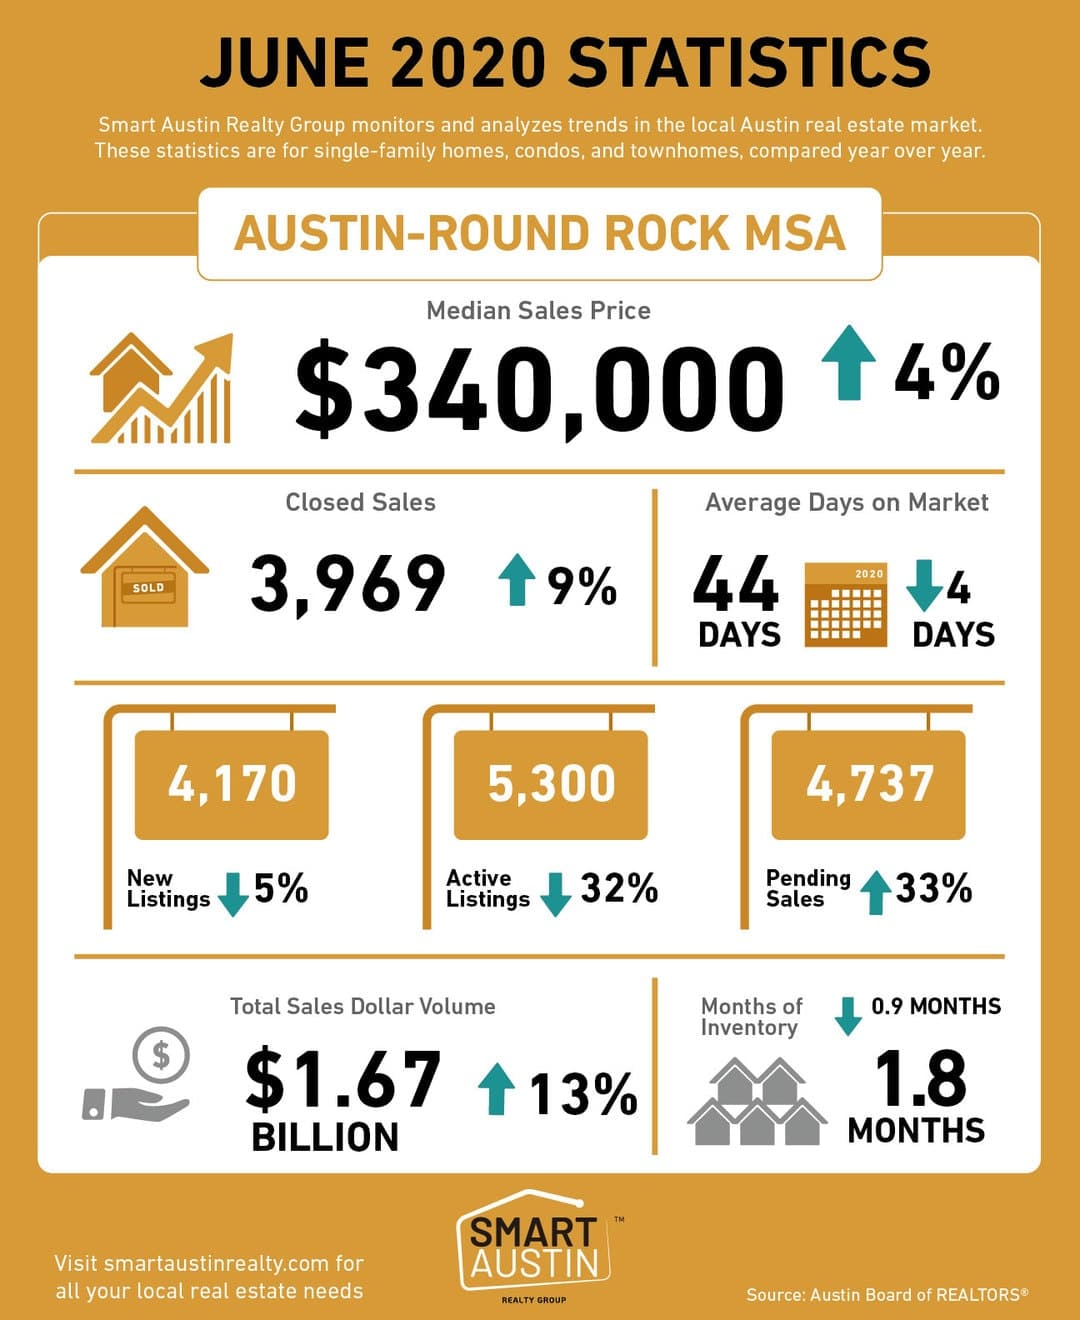
Across the five-county MSA in June, residential home sales increased 9.3% year over year to 3,969 sales, and the median price increased by 4.6% to $340,000. Sales dollar volume also increased 13.1% to $1,674,070,282 and pending sales increased by 33.7% to 4,737. Housing inventory declined 0.9 months to 1.8 months of inventory, demonstrating an extremely competitive and tight market across the region, even as it begins to show signs of improvement.
“Strong home sales in June are good news for the real estate market across the region,” Romeo Manzanilla, 2020 ABoR president, said. “The increased sales last month helped limit the impact of the pandemic on the first half of the year overall. Increased pending sales signal a strong month of sales in July, but we have to remain cautious as Texas experiences a spike in COVID-19 cases and we are seeing shrinking housing inventory.”
Despite an increase in pending sales, new listings dropped 5.4% to 4,170 listings, and active listings dropped 32.2% to 5,300 listings.
Manzanilla added, “As listings fell again, REALTORS® continue to help clients stay safe by implementing new precautions, such as virtual showings and enhanced digital floor plans. It’s the perfect time to talk to a REALTOR®, who can help you decide what makes sense for you and your family. If your home needs have changed, there are plenty of potential buyers amid record-low levels of inventory levels across the MSA and a REALTOR® will make finding a new home in a tight market a possibility.”
James Gaines, chief economist for the Real Estate Center at Texas A&M University, thinks perspective is needed when interpreting the market throughout 2020.
“There are plenty of unknowns in the months ahead, but June home sales across the MSA being up 9.3% YoY was tremendous when considering the strength of 2019. And while home sales declined throughout the Austin-MSA during the first six months of 2020, we are still on track for a strong year,” Gaines said.
Gaines noted that while June saw strong numbers throughout all of Texas, Austin’s inventory shortage remains extremely problematic.
“Extremely low inventory is one of the factors that affects overall sales dollar volume while simultaneously creating a very competitive and tight market. Home builders aren’t building quite as many new homes and sellers were hesitant to list their home during shelter in place orders. Even if we end up with a 3 to 4% decline in sales in 2020, that would still be a strong year for the region.”
Austin-Round Rock MSA midyear performance
In the first half of 2020, homes sales in the Austin-Round Rock MSA declined 5.2% year over year to 17,043 home sales. Sales dollar volume declined 1.9% to $6,897,765,107, while the median price increased 4.9% to $325,200. So far this year, new listings declined 7.5% to 22,744 new listings; active listings dropped 19.2% to 5,616 listings. However, pending sales slightly increased 2% to 20,389 pending sales.
City of Austin
In the City of Austin, home sales in the first half of the year decreased 13.6% year over year to 5,291 sales, while the median price rose 9.7% to $406,000. At the same time, sales dollar volume decreased by 6.2% to $2,621,719,744. New listings dropped 9.7% to 7,498 listings; active listings declined 21.8% to 1,398 listings; and pending sales also fell 8.9% to 6,201 pending sales.
In June 2020, there were 1,163 home sales, down 5.3% year over year. Last month, sales dollar volume inched up by 0.2% to $588,734,242, while the median price slightly increased 3.3% to $407,000. During the same period, new listings decreased 5.3% to 1,448 listings; active listings tumbled 26.4% to 1,520 listings; and pending sales jumped 21.7% to 1,478 sales. Housing inventory decreased 0.4 months to 1.6 months of inventory.
Travis County
In Travis County, home sales decreased 10.3% year over year to 8,452 home sales in the first half of the year. During the same period, sales dollar volume dropped 6.5% to $4,078,268,052, as the median price rose by 7% to $385,000. New listings decreased 10.8% to 11,721 listings, and active listings dropped 24% to 2,572 listings. Pending sales also fell 5.3% to 9,976 pending sales.
In June, home sales decreased 0.8% year over year to 1,935 home sales, while sales dollar volume rose by 4.3% to $980,584,301. During the same period, the median price increased 3.5% to $398,250. New listings declined 8.1% to 2,165 listings; active listings dropped 31.9% to 2,626; while pending sales jumped 22.3% to 2,313 pending sales. Housing inventory fell 0.8 months to 1.7 months of inventory.
Williamson County
In Williamson County, home sales in the first half of 2020 declined 3.6% year over year to 5,767 home sales. During the same period, sales dollar volume remained flat at $1,877,370,936, and the median price increased 2.8% to $291,920. New listings decreased 4.8% to 7,325 listings; active listings dropped 19.2% to 1,803 listings; while pending sales increased 6% to 6,958 pending sales.
In June, home sales increased 16.1% year over year to 1,352 home sales. During the same period, sales dollar volume jumped 21.9% to $458,305,463, and the median price increased 4.9% to $304,090. New listings increased 2.1% to 1,400, while active listings tumbled 35.1% to 1,615 listings. Pending sales spiked 41.7% to 1,605 pending sales. Housing inventory fell 1 month to 1.6 months of inventory.
Hays County
In the first half of 2020, Hays County home sales rose 12.2% year over year to 2,137 home sales, and sales dollar volume rose 19.6% to $754,871,620. During the same period, the median price increased 4.9% to $278,995. New listings slightly fell 0.5% to 2,679 listings; active listings declined 10.8% to 822 listings; and pending sales jumped 21.2% to 2,592 pending sales.
In June, home sales jumped 38.6% year over year to 535 home sales, and sales dollar volume also skyrocketed 48.6% to $193,556,186. During the same period, the median price rose by 6.6% to $287,265. New listings decreased 13.6% to 419 listings; active listings fell 31.6% to 690 listings; and pending sales spiked 60.6% to 604 pending sales. Inventory dropped 1.2 months to 2.0 months of inventory.
Bastrop County
In the first half of 2020, Bastrop County home sales increased 2.7% year over year to 539 home sales, and sales dollar volume increased 12.6% to $150,584,845. The median price increased 9.9% to $256,000. During the same period, new listings declined 3.1% to 804 listings, as active listings rose 2.8% to 328 listings. At the same time, pending sales increased 14.2% to 677 pending sales.
In June, home sales increased 7.4% year over year to 116 home sales, and sales dollar volume climbed 16.2% to $33,337,768. At the same time, the median price increased 14% to $268,000. New listings dropped 0.7% to 148 listings; active listings fell 20.4% to 288; while pending sales jumped 52.3% to 169 pending sales. Inventory declined 1.1 months to 3.0 months of inventory.
Caldwell County
In the first half of 2020, Caldwell County home sales increased 5% year over year to 148 home sales, and sales dollar volume increased 21% to $36,639,286. The median price climbed 4.5% to $209,000. During the same period, new listings dropped 8.5% to 215 listings; active listings declined 1.1% to 89 listings; while pending sales increased 21.6% to 186 pending sales.
In June, home sales spiked 40.9% year over year to 31 home sales, and sales dollar volume jumped 58.8% to $7,577,358. During the same period, the median price rose 7.2% to $204,239. New listings dropped 17.4% to 38 listings; active listings decreased 23.6% to 81 listings; while pending sales increased 53.3% to 46 pending sales. Housing inventory fell 1.2 months to 3.2 months of inventory.
For more information and to download the June and Midyear 2020 Central Texas Housing Market Report, visit www.abor.com/statsjun20.


