AUSTIN-ROUND ROCK MSA
First Quarter 2022

Executive Summary
- Metro area sales volume decreased 1% to 8,182 transactions. Median price increased 25.9% year-over-year to $500,000.
- 2022 Q1 months inventory for all residential properties rose 44.1% year-over-year to .5 months.
- Metro area residential property listings increased 46.1% year-over- year to 1,731 active listings.
- Single-family new construction median price increased by 43.4% year-over-year to $462,305.
- Single-family rental average rent increased by 12.8% year-over-year to $2,200.
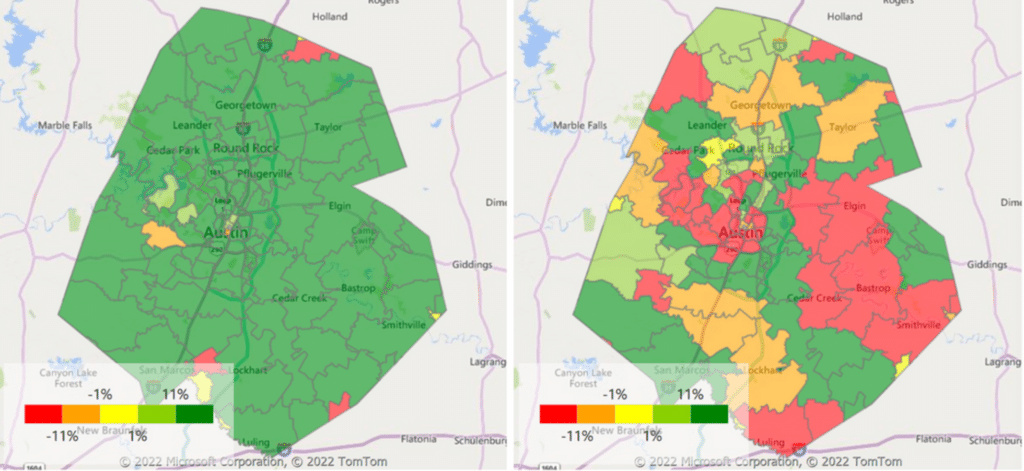
Median Price Change (YoY) Sales Volume Change (YoY)
KEY MARKET METRICS

Median price in the Austin- Round Rock metro increased by approximately 25.9% year-over- year, from $398,000 to $500,000. Metro area price exceeded the statewide median price of $325,000 by $175,000.
2022 Q1 total sales volume decreased by approximately 1% year-over-year, from 8,264 to 8,182. Sales of homes between $500k and $750k rose from 1,624 to 2,569, while homes between $400k and $500k rose from 1,408 to 2,073, and homes between $300k and $400k dipped from 2,004 to 1,544.
Metro area months inventory increased year-over-year from .35 to .5 months. Homes between $500k and $750k rose year-over- year, from .53 to .56 months, while homes between $400k and $500k rose year- over-year, from .33 to .4 months and homes between $300k and $400k fell year-over-year, from .24 to .21 months.
Average days to sell throughout the metro area remained stagnant compared with the same quarter last year. Average days to sell for homes between $500k and $750k increased from 67 to 70 days, a 4.5% increase year-over-year.
SINGLE – FAMILY NEW CONSTRUCTION

Homes in the $400s and above range grew to 66.2% of single- family new construction sales through the MLS. The second most active price range was homes in the $300s, which grew from 25% to 27.3% year-over- year.
In the latest quarter, the average price was $545,269 for new homes sold through the MLS, an increase over last year’s figure of $407,791. Average price for existing homes was $642,388, an increase over last year’s figure of $555,612.
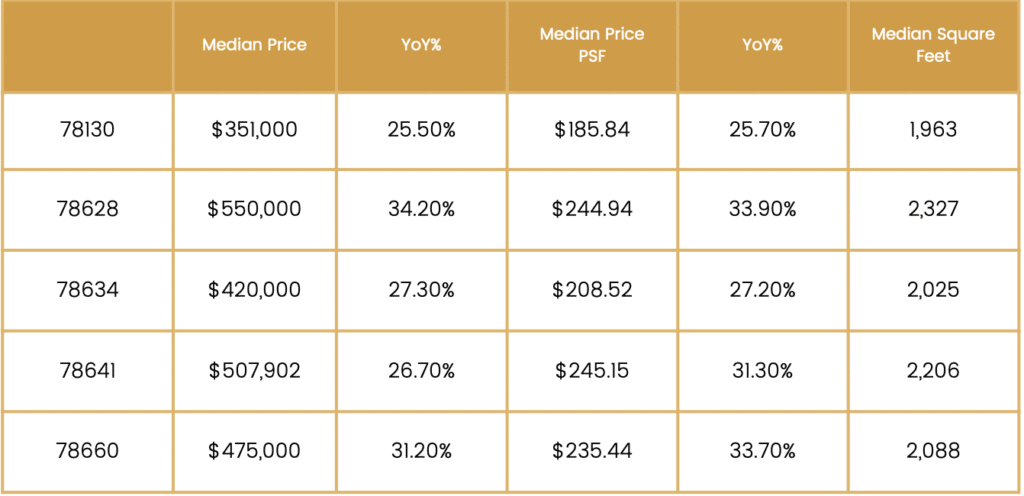
Top 5 Most Active Zip Codes
SINGLE-FAMILY RENTALS
 Average rent per square foot for single-family properties was $1.33, an increase compared with last year’s rental rate of $1.23. The average home size was 1,928 square feet.
Average rent per square foot for three-bedroom single-family properties was $1.44, an increase compared with last year’s rental rate of $1.30. For four-bedroom single-family homes, the rental rate per square foot was $1.16, an increase compared with last year’s rental rate of $1.09.
Rental Metrics by Bedroom Count

HOUSING METRICS BY COUNTY
Bastrop County

Caldwell County

Hays County

Travis County

Williamson County


